
Here we are on RetroRGB.com. And let’s take a moment to really ponder that last bit – RGB. What’s in a colour? Pretty simple right? Red is red, green is green, blue is blue. Or is it?
Let’s ask our little buddy Link what he thinks:
Can you pick which is the “right” colour?
In their simplest terms, colours are defined by electromagnetic radiation wavelengths. And for all EMR in the universe, we can only see a very small amount – somewhere in the order of 400 to 700 nm or so (supposing we are fortunate enough to be blessed with perfect vision). These look to us like a spectrum ranging from blues and deep violets at the highest frequencies (i.e.: shortest wavelengths) to reds at the lowest frequencies / longest wavelengths. My preschool teacher would give us the acroynm “Roy G. Biv” to remember our red, orange, yellow, green, blue, indigo and violet “7 colours”. What wonderful, simple times.
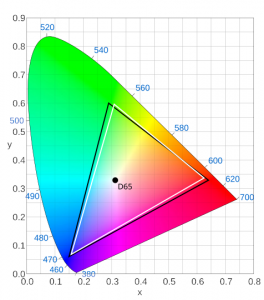
Notably missing from that spectrum are colours like pink. Perhaps somewhat surprisingly, pink doesn’t exist as a single wavelength. It’s only formed in our minds when we see a combination of wavelengths. Back in 1931, some clever boffins decided to map all these colours onto a chart, which looks like this:
![]()
The classic “horse shoe” shape across the top is our colour spectrum, with number representing the wavelength of light in nanometers. Bent into that horse shoe shape, we can then look at the relationship of those colours as they mix. Very specifically in humans, the three cone cells inside our eyes (making us “trichromats“) respond to red, green and blue wavelengths. If you’re a honey bee, you’d have cones responding to blue, green and ultra violet instead. Our household dogs and cats only have two, with much more emphasis on their rods for night vision (making TV watching not so fun for them). Chickens (and most birds in fact) get a fourth which helps them distinguish food on the ground far more accurately than us. The incredible mantis shrimp is estimated to have somewhere between 12 and 16 colour cones, making their perception of the world one heck of a psychedelic technicolor fever dream.
However for we boring humans, we bend this line somewhere around green to make this horse shoe shape based on our three cones (which we deem our “primary colours”), and allow us to also see the impact of what happens when those colours are mixed. Mixing some reds and blues give us shades in the pink/magenta area, for example – colours that don’t exist as single wavelengths, but appear as individual colours inside our brains as they attempt to process multiple signals at once.
Similarly, white light doesn’t exist. It’s a mix of the colours we see. And even then, there’s no true perfect white. We instead measure white by “temperature”, using physics principles around the temperature of stars and suns. Earth’s own sun sits at around 5772 Kelvin (5498 degrees C, or 9930 degrees F) at its surface. This yellowish light then hits our atmosphere and is refracted, giving it a slightly bluer colour. Exactly what colour that is depends entirely on both your latitude on planet Earth and time of day. Independent researchers in both New York and Northern Europe agreed on taking midday sun measurements at around the 43rd parallel north (which covers a pretty decent chunk of Earth’s population), and deemed that the “colour temperature” was pretty close to 6500K (a slightly bluer than our sun) “white point”. This standard daylight illuminant was given the title “D65”, and considered to be “white light” for many things from that point forward.
So what does any of this have to do with RetroRGB? Well, those marvelous CRTs we all know and love at some point needed to represent this physical world, and show colours of things we recognised. These incredible inventions use a charged anode to fire an electron beam at a cathode screen (hence Cathode Ray Tube, or CRT), and in doing so strike phosphors on the front of the screen. These phosphors absorb the electron beam energy, and then dissipate that energy as light. Let’s check on our little buddy Link, and see what he looks like on a particular low resolution domestic CRT:
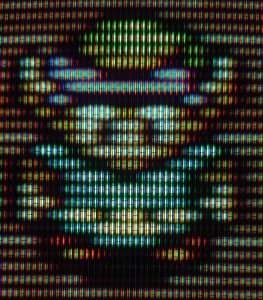
Familiar enough. Zooming right in to the “white” part of Link’s eye, and of course we see…
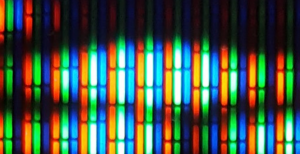
Sure enough, there are our red, green and blue phosphors, all lit up and excited. And with just those three colours and human-specific vision, we can simulate most of the other stuff by mixing them in different levels.
So that all works nicely. The only problem now is that these phosphors can’t really show off the full range or “gamut” of colour that humans can see. So that’s an easy fix, we can just create a standard for all displays to conform to, and squeeze our pictures in there. Of course, we all know the joke about standards. But without spoiling the punchline just yet, let’s take a look at a common standard like ITU-R BT.601-525, or more commonly what standard definition NTSC CRT televisions should have conformed to around the late 90s:
Well immediately we see some interesting things. Firstly, the triangles we see there represent the extreme possibilities of the red, green and blue colours for that standard. But immediately we notice there are two triangles. Why? Well if you’re in a PAL territory like me, (1) you’ll likely spell “colour” this way and “grey” that way, and (2) your standard points for the primaries are ever so slightly off compared to our NTSC friends (with BT.601-525 existing for NTSC, and a very slightly different BT-601-625 existing for PAL). This isn’t so much of an issue because we make our video and TV content specific to these standards, so even though these definitions are off, content created in one standard and converted to another should look the same. Same goes for video game consoles that spat out RGB colours through encoder chips, and should land in roughly the same colours for everyone (with notable exceptions like the Nintendo NES, which didn’t use RGB colour, and is a whole other wall of text to explain that wackiness).
And then, a spanner in the works. For many years it was noted that in Japan, there was a preference for a much “cooler” white point. We say “cooler” because of the bluer tone, however that white point was a higher temperature – closer to 9300K (compared to the 6500K used in the west). Much like distant stars on which this maths is based, hotter suns produce bluer light (despite our colloquial notation of associating blue with cold). But, this changes things quite dramatically when viewing a picture. If you imagine our colour triangle from above where white extends out of the screen in a Z axis towards the viewer, making more of a pyramid shape (the actual shape doesn’t look like this, but let’s pretend for simplicity) – if you move the white point over, you change where the tip of the pyramid is. From here, all of our colours shift a little too. The brighter the colours, the more dramatic the shift.
And then, another spanner in the works. It was discovered that the chemical makeup of the phosphors used in certain brands televisions around the world were slightly different. End result was even our base colour triangle changing shape as the R, G and B primary points change slightly. Examining page 18 of the Japanese ARIB TR B9 v1 and feeding it through Google Translate, we find a very interesting bit of data:
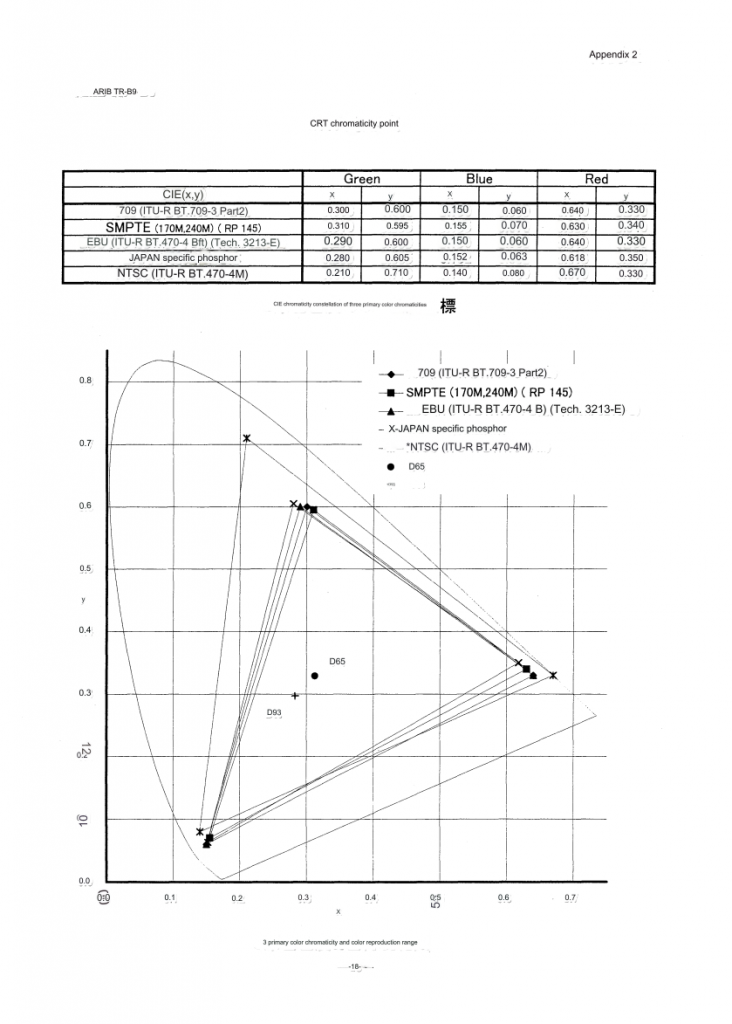
Note the “Japan specific phosphor”! Likewise see how far apart the D65 and D93 white points are. What’s fascinating about this is that showing an unchanged RGB signal in one standard versus another will produce some pretty different images.
So which is right and which is wrong? Well, both. Or neither, depending on if you’re an optimist or a pessimist. But what is true is that multiple standards exist. Not just in simplistic terms of white points, but also across a wide variety of display devices that used different phosphors even for their R, G and B co-ordinates.
For many CRT enthusiasts, this story isn’t new. Travel the various CRT collector communities over the decades, whether older shmups forums threads or newer Reddit communities, and the “D65 vs D93 debate” continues on and on. How people calibrate their monitors and to what standards – whether they prefer the western “warm” colours or the Japanese “cool” colours – fills pages of our Internet. However, the glaring downside of this debate is that in order to see these standards, you have to fiddle with your TV’s settings, putting it permanently into one mode or the other in order to accurately see these differences.
Or at least, you used to. Here in the modern world we’re blessed with vary fast computers and GPUs and FPGA devices that are very, very good at flipping pixels about pretty quickly. In theory, we could write conversion tools that allowed us to fairly accurately simulate various devices, and do so at the flip of a switch with no need to re-calibrate our displays. Merely choosing a “profile” of sorts would allow us to simulate the colour of other displays, not unlike the fantastic work already going in to shaders, shadow masks, and pixel bloom that continues to evolve and improve thanks to high resolution displays and the deep blacks of OLEDs with the high brights of HDR.
There are limits to this accuracy on legacy displays – our standard sRGB SDR PC monitors and BT.709 SDR TVs for example will both “clip” colours converted from Japanese standards – again, imagine these full colour volumes as simple pyramids, move the points of the pyramid around in 3D space slightly, and certain points are going to exist outside the bounds of others. However as we move into the future of BT.2020 wide colour gamut and HDR screens, we’re presented with some wonderful opportunities to see these full ranges of colours from different regions quite accurately.
How do we do this? Just a wee bit of maths courtesy of the wonderful colour scientist Bruce Lindbloom:
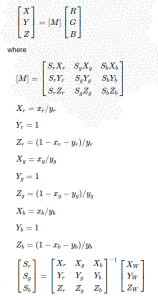
Simple stuff, right? I’ve adapted these into some open source Python code, and then from there produced some matrix files that developers can use for free in things like emulators, shaders, scaler hardware and other devices. For anyone interested, the repo is hosted here:
https://github.com/danmons/colour_matrix_adaptations
Included in the repo for now are as many colour standards as I could get my hands on, as well as some very accurate measurements from real world PVMs from Keith Raney, who took incredible time and care in not only servicing his PVMs electronically to very accurate internal measurement levels according to Sony service manuals, but then also taking the care to profile the CRTs with a high accuracy colorimeter, and give me the results to feed into this maths. What do these results look like? Let’s cycle through a couple of outputs from some famous games. Remember – these are not “palettes”. These are representations of completely different colour systems and even physical displays.
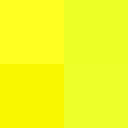
And let’s break down some of our specific colours that we pluck out of these images. For those curious:
* Top left – sRGB D65
* Top right – sRGB D93
* Bottom Left – ARIB TR B9 v1
* Bottom Right – Keith Raney’s measured Sony PVM 20M2U
 – The terminals in the Super Metroid title screen
 The orange in the Super Metroid title
 The yellow in the Super Metroid title
 The green in the Zelda grass
 – The blue in the Zelda water
 The white in the Zelda magic container and shield outer layers (the sRGB D65 white will very likely blend in to the white background of this document, given that it too is sRGB D65).
Fairly dramatic differences!
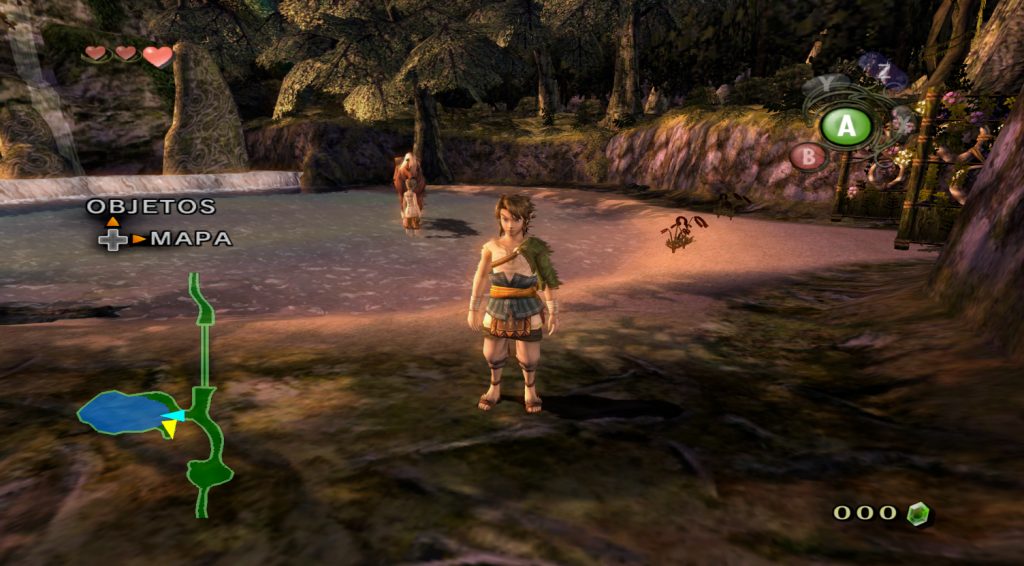
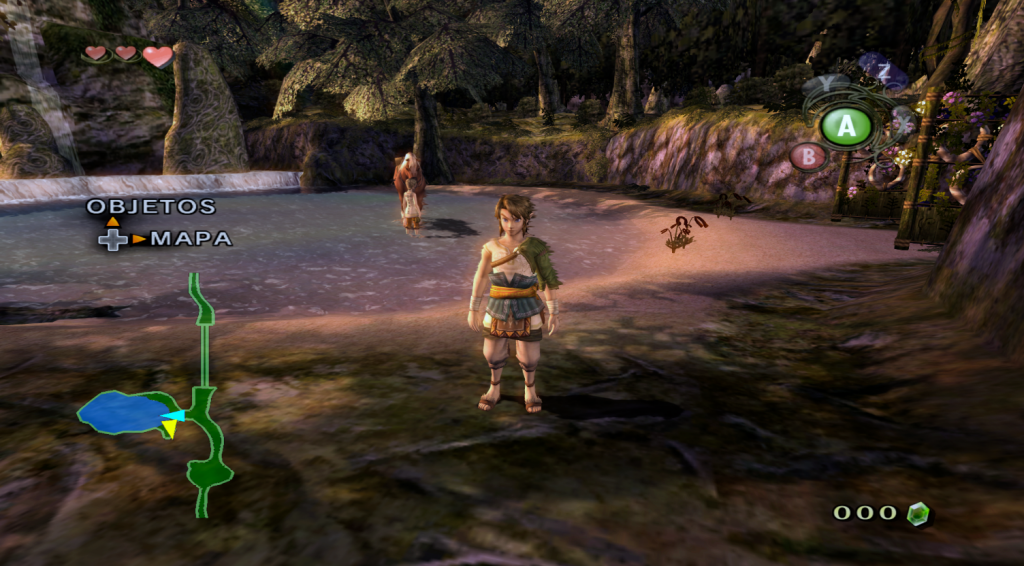
Whether 2D or 3D, we can see this in action. The Wii’s Twilight Princess was a famously “warm” game on western D65 consoles. Was it meant to be viewed that way, or was it meant to be viewed on a cooler Japanese D93 screen? Subtle differences that change the feel of the scene from potentially an afternoon setting to closer to midday? The top image is taken from this Dolphin pull request from someone doing similar work, the bottom is my matrix conversions applied, which should look very similar to the D93 one in that same link, which is what sparked my attempt to recreate this in a purely mathematical way in the first place.
Similar work also exists in Dogway’s Grade Shader. Lovely to see enthusiasm for these subtle differences already, and with any luck as we delve into a new era of HDR displays. It’s lovely to see emulation and simulation of old systems move into this new era of accuracy, and look at documenting the regional differences of not only the games themselves, but the very displays they would have been enjoyed on by people all around the planet, and across decades of time.
“RetroRGB” continues to be a wonderfully apt summary of this hobby. No matter how you like your reds, greens and blues, there’s lots of fun to be had with these experiments into the future.